By Stephen Ibanez (sibanez@stanford.edu) and Kostis Kaffes (kkaffes@stanford.edu)
Introduction
The best performing congestion control algorithms today allow flows to maximize their throughput while maintaining small queues in network switches. Having small queues is important because it decreases latency for short flows by minimizing queuing delay and it also allows the buffers to absorb transient micro-bursts without dropping packets and thus significantly improves performance. The DCTCP paper [1] by Alizadeh et al. presents one solution to maintain small queues for data center switches without sacrificing throughput. It makes use of Explicit Congestion Notification (ECN) in the switches to indicate the presence of congestion to the end hosts, which can then adjust their sending rate accordingly. The authors found that DCTCP provides equivalent throughput to TCP while utilizing 90% less buffer space.
Motivation behind DCTCP
Data centers host a diverse mixture of applications ranging from batch processing to user-facing workloads. The former generate large background flows that require high sustained throughput while the latter create short latency-critical follows with strict completion time requirements. The performance and efficiency of these two types of traffic is very important in determining the viability of a cloud service. In fact, Amazon found in 2008 that every 100ms of additional latency cost them 1% in sales. Furthermore, the huge costs associated with data centers and the need for continuous scaling has led to the use of commodity Top-of-Rack (ToR) switches with shallow buffers. Appenzeller et al. [2] showed that small buffers should be enough in the case of regular TCP traffic. However, their assumptions do not stand in the data center setting. There is only a small number of concurrent long flows and thus statistical multiplexing is not possible. Also, due to the pattern of the requests served in the data center short flows tend to be synchronized and require a large amount of buffering simultaneously. Simply increasing the buffer size is not enough. Vanilla TCP uses packet drops as congestion signals. This means that it allows for queue buildup which makes short, latency-critical flows experience delay stuck behind packets from the large flows in the queue.
DCTCP tries to fix these problems by responding to congestion proportionally. The system is no longer either congested or not congested; there are various levels of congestion. It achieves that by employing a very simple active queue management scheme. Switches set a bit signaling congestion to an arriving packet if the queue length is greater than a parameter K. The receiver sets the ECN-Echo flag to the ACK packets it sends to the sender for every packet marked as congested by the router. Finally, the sender keeps a running estimate of the percentage of lost packets α and every time it needs to reduce the congestion window size according to regular TCP, it reduces it by a factor of (1 – α / 2) instead of a factor of 2. Thus, when only a few packets experience long queues, the window is slightly decreased and high bandwidth is sustained.
Original Results
The authors thoroughly evaluate the performance and properties of DCTCP using an actual cluster of 94 machines in 3 racks. It is shown that DCTCP provides equivalent throughput to TCP while utilizing 90% less buffer space. A series of micro-benchmarks is used to show how DCTCP handles the traffic patterns that cause problems to TCP in a data center environment. The next section identifies the key results we would like to replicate in this project.
Reproduction Goals
For this project, we reproduce Figures 1, 13, and 14 from the original DCTCP paper (shown below). Figures 1 and 13 demonstrate that DCTCP is able to operate with significantly smaller queues than TCP. Figure 14 shows that DCTCP achieves the same throughput as TCP if the threshold parameter K is configured appropriately. We chose to replicate these figures because they demonstrate what we believe to be the key results of the paper: DCTCP is able to maintain small queues without sacrificing throughput.
The paper provides all the parameters such as the ECN marking threshold K and the weight g used for the experiments making the reproduction easier.


Reproduction Methodology and Results
We found implementations of DCTCP for both Mininet and the NS-2 simulation platform. We chose to use the latter because we believed that it would be more feasible to experiment with new congestion control algorithms since it does not require modification to the Linux kernel. We found that the results we selected to examine from the DCTCP paper are indeed reproducible with NS-2.
We constructed the topology and workload shown in Figure 1. Each link is configured to have 100Mbps of capacity, 0.25ms of latency, and 200 packets of buffer space. We did not run the experiments with the 1Gbps links used in the original paper because there was an issue with NS-2 that prevented simulations from terminating properly. However, we are still able to accurately compare results because using a lower link speed does not significantly affect the analysis.
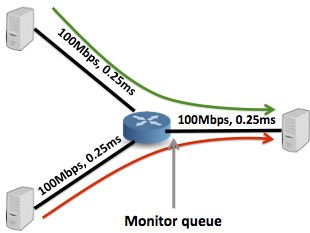
Figure 1: The topology used replicate Figure 1 in the DCTCP paper.
In Figure 2 we measure queue size over time when using both NS-2’s implementation of TCP Linux and DCTCP. For the DCTCP experiment we set the marking threshold K = 20 packets and the window adjustment parameter g = 0.0625. As we can see, since TCP uses packet loss as the congestion signal it maintains a large queue occupancy. We also see that DCTCP does indeed ensure that the queue occupancy is very low, as suggested by Figure 1 in the original DCTCP paper. However, we observe that our simulated TCP queue occupancy looks slightly different than it does in the DCTCP paper. This may be due to use of a different TCP congestion control algorithm than the original paper or the fact that it is much more likely for the TCP flows to be synchronized in the simulator than in a real system.

Figure 2: Queue size over time for TCP and DCTCP. This is a reproduction of Figure 1 from the DCTCP paper.
Next, we plot the Cumulative Density Function (CDF) of the queue size for both TCP and DCTCP using two topologies. In one topology, two distinct senders establish long lived flows sharing a single bottleneck link to a common sender, as shown in figure 1. In the other topology, we use 20 distinct senders. We use the same constants as before, i.e. K=20 packets, g=0.0625, buffer size of 200 packets, link capacity 100Mbps and round trip time of 1ms. Again, we observe behavior very similar to the original DCTCP paper with the DCTCP queue size being practically bounded by a very small value. The only major difference is the fact that the CDF of TCP with 20 flows is increasing much more gradually than in the DCTCP paper. We believe that this is once again due to a higher degree of synchronization amongst the flows in out simulations.

Figure 3: Queue length CDF for TCP and DCTCP for both 2 flows and 20 flows. This is a reproduction of Figure 13 from the DCTCP paper.
Finally, in Figure 4 we observe the throughput as we vary the value of threshold K. The DCTCP paper suggests that in order to prevent the queue at the bottleneck link from going empty and hence wasting capacity, the parameter K must satisfy: K > (RTT × C)/7. In this experiment we use a link capacity of 100Mbps, RTT of 40ms, 1500 byte packets. Therefore, we would expect that the throughput when using DCTCP should stop depending on K after it exceeds about 45 packets. Our simulations suggest that this analysis is indeed accurate. It also shows that DCTCP is able to achieve the same or even better throughput than TCP when K is configured properly.

Figure 4: Throughput over threshold K for TCP and DCTCP. This is a reproduction of Figure 14 from the DCTCP paper.
Challenges
One of the challenges that we ran into was trying to familiarize ourselves with NS-2’s tcl-based API. Neither of us were familiar with the tcl scripting language prior to working on this project so we had to climb the initial learning curve. Fortunately, we were able to get a hold of a patch file that added DCTCP support to the NS-2 source files so we did not have to implement it ourselves. We also managed to find some example tcl scripts that made use of the DCTCP functionality added to NS-2. It was however, difficult for us to parse these tcl scripts and understand how to properly configure the DCTCP agents for the simulations. We hope that the scripts in our repository provide a clear and understandable reference for those who would like to understand how to properly use DCTCP in NS-2.
We also ran into a bit of trouble when trying to determine the best way to make our results reproducible. While Google Compute Engine (GCE) does provide a way to create custom images, it does not provide an easy way to then make those custom images publicly available. This is unfortunate because we would have liked to be able to provide a prebuilt image with all the dependencies installed. We are trying to circumvent this problem by providing a Docker container.
Future Work
We would like to compare DCTCP to a new TCP congestion control algorithm that we are in the process of designing and implementing. The algorithm will take advantage of the In-band network telemetry [3] to obtain the largest queue size along the path of each flow. Using this information, the TCP sender will be able to know exactly how it should adjust its congestion window in order to allow sustained operation with virtually no queueing delay in the network, while still achieving maximum throughput. This idea is built off of DCTCP in the sense that the network switches/routers participate in the congestion control algorithm. However, by providing the exact size of the queue the sender is able to obtain more information about the current state of the network and hence is able to react more precisely. We still need to develop an analytical model to determine exactly how the sender should react to this new information that arrives in every ACK packet.
Reproduction Instructions
The instructions that follow are also listed in the README file for the repository.
The results are designed to be reproduced on a machine running Ubuntu 14.04. It is recommended to run the simulations on a Google Compute Engine instance to ensure maximum consistency and reproducibility. Below are the instructions to reproduce:
(Optional) Google Compute Engine Instance Setup
This method requires that you have a Google Cloud account and associated billing account (or free trial) set up.
- Navigate to your Google Cloud Console and click “Compute Engine > Images” on the left hand side.
- Search for the ubuntu-1404 image and select it. Click “CREATE INSTANCE”.
- Choose a name for your instance (e.g. dctcp-ns2). Choose your desired zone to host your instance. Choose 4 vCPUs as the machine type. Make sure to check the box to allow HTTP traffic. Click “Create”.
Installation and Reproduction Steps:
- Install git and make:
$ sudo apt-get -y install git make - Clone the repository:
$ git clone https://github.com/sibanez12/dctcp-ns2.git - Install the dependencies (this will take about 8 minutes):
$ cd dctcp-ns2 && make - Reproduce the results (this will take about 5 minutes):
$ ./run.sh
The plots will be saved in the plots/ directory. When the simulations are complete and the plots have been produced, an HTTP server will be started up automatically (may need to enter sudo password).
- Please identify the External IP address of the machine you are running the simulations on and use your bowser to navigate to http://IP_ADDRESS or to http://localhost if you are running on a local machine. Click a link to view the corresponding figure.
(Optional) Reproduction using Docker:
The plots can also be easily generated using Docker.
- Install docker:
$ sudo apt-get -y install docker.io - Download the Docker Image with our repository pre-installed:
$ sudo docker pull kkaffes/dctcp - Start a container from that image:
$ sudo docker run -i -t --name dctcp kkaffes/dctcp - Reproduce the results (this will take about 5 minutes):
# cd ~/dctcp-ns2 && ./run.sh
Again, the plots will be saved in the plots/ directory. When the simulations are complete and the plots have been produced, an HTTP server will be started up automatically. The user can identify the IP address of the container by running: $ sudo docker inspect dctcp | grep IPAddress in the host and navigate to http:// to view the results.
Acknowledgements
We would like to thank Mohammad Alizadeh for sharing the DCTCP patch file for NS-2 with us. We would also like to thank Jonathan Perry for some sample tcl scripts that demonstrated how to use DCTCP in NS-2.
References
[1] Alizadeh, Mohammad, et al. “Data center tcp (dctcp).” ACM SIGCOMM computer communication review. Vol. 40. No. 4. ACM, 2010.
[2] Appenzeller, Guido, Isaac Keslassy, and Nick McKeown. Sizing router buffers. Vol. 34. No. 4. ACM, 2004.
[3] Kim, Changhoon, et al. “In-band network telemetry via programmable dataplanes.” ACM SIGCOMM. 2015.

The Docker container worked fine for me—made it very easy to reproduce your reproduction. Thanks!
Reproducibility: 5/5
We were able to reproduce the graphs presented in the blog post by following the steps. Running the script took about 7 minutes on our setup.
Here are the results we could generate:
