Team: Daniel Perry, Sandeep Chinchali
Goal:
Data Center TCP (DCTCP) [1] is a congestion control mechanism that prevents bandwidth hungry background flows from unnecessarily delaying latency sensitive, short foreground traffic in data-centers by consistently keeping queues small. DCTCP achieves this goal by effectively curbing senders’ rates during times of congestion by means of Explicit Congestion Notification (ECN) feedback. When the queue size on a bottleneck link becomes larger than a threshold  , DCTCP marks packets with the ECN flag, signaling that the senders must slow down to keep queue sizes small, avoid congestion, and not delay short flows. The frequency at which multiple single-bit ECNs are received allows DCTCP to leverage multi-bit feedback about network congestion.
Motivation:
DCTCP addresses a fundamental problem inherent to data-centers, where latency sensitive short queries must be resolved within strict time deadlines despite the presence of large flows that might dominate scarce buffer space. The DCTCP paper systematically finds experimental evidence for this phenomenon in real data-center workloads and offers a congestion control algorithm to consistently keep queue sizes small.
Results:
The original authors of DCTCP devised a simple algorithm where a receiver marks packets with the ECN flag if the bottleneck link buffer size (in packets) is above a threshold . The senders keep a running estimate of the percentage of marked packets to estimate the extent of congestion. They react by reducing the window size in proportion to the extent of congestion.
The authors mathematically derived the following guideline for choosing the marking threshold , which we experimentally validate:
For an idealized setting of  infinitely long-lived, synchronized flows competing for a bottleneck link of
  packets/sec with a roundtrip time of
  sec, the marking threshold should satisfy
  packets.
Subset Goal and Motivation:
Since the choice of marking threshold is a critical parameter of DCTCP, we want to determine how robust the congestion control algorithm is to variation in threshold within an experimental setting. As such, our project proposal is to experimentally validate Equation 13 in [1] which provides a minimum bound on marking threshold to never underflow the receiver’s buffer ( packets).
Methodology:
In the network emulator Mininet, we created a simple star topology of two senders connected via an ECN-enabled switch to a single receiver via a bottleneck link of capacity . Since our goal was not to test the robustness of DCTCP to various topologies but rather experiment with marking thresholds, such a simple star topology is justified.
Each experiment is characterized by a specific value of , bottleneck capacity , and marking threshold . In each experiment, both senders maintain a sustained iperf connection to flood packets through the network to the receiver. We measure the queue size on the bottleneck link after the iperf connection has reached steady state and plot the percentage of time the queue under-runs, which occurs if the congestion control is too cautious and marks packets too early due to a small threshold .
The marking threshold is implemented using Linux’s RED (Random Early Detection) queueing discipline. In RED, a real-time estimate of the instantaneous queue size is kept and if the size is below a minimum threshold ( ), a new packet is always enqueued while if the size is above an upper bound (
 ), a new packet is always dropped. If the queue size lies between the bounds of and , a new packet is enqueued with a probability
  .
.
We wish to emulate DCTCP’s behavior, specifically the deterministic dropping of packets if the queue size is above threshold , using the RED discipline. As such, we set the RED parameters as follows, adhering to inherent limitations in RED. We denote the average packet size as  bytes. Since and are measured in bytes and taking into account RED’s inability to have
  , we set
  and
and  . To account for RED’s criterion that the burstiness must be at least
  , we set
  and further set probability
  to deterministically drop packets for DCTCP emulation.
Once the value of threshold is configured, the bulk of testing consisted of measuring the queue occupancy versus time for various values of , , and . We denote  =
=  to be the value predicted by the DCTCP authors. By changing relative to , we can verify if indeed the queue will under-run, and to what extent. To measure the degree at which we deviate from the cited value of , we plot results against the fraction
  . Based on the DCTCP paper, we should expect the queue to under-run for
  and the buffer to not overrun when
  .
.
Results:
In the first set of plots (Figure 1), we plot queue capacity vs. time for various fractions of . As expected, the buffer under-runs when and the extent of time the buffer is empty is longer when the fraction is reduced. Such behavior occurs because senders are prematurely warned of congestion due to the small value of and hence excessively curtail their transmission rates, leading to a loss of throughput.
We see that the buffer is relatively stable and does not under-run when  . Though the paper derives that the buffer should not under-run when
  , the authors acknowledge that in practice the threshold may need to be a small factor times to avoid under-running the buffer as we see experimentally. However, our experimental results do show that the derived threshold of leads to the buffer rarely under-running, which corroborates the result.
-

-
Fraction = .25
-

-
Fraction = .50
-

-
Fraction = .75
-

-
Fraction = 1
-

-
Fraction = 2
-

-
Fraction = 5
-

-
Fraction = 10
-

-
Fraction = 20
Figure 1: Queue size vs. time for various thresholds . For a link of  and
and  ,
,  . We changed threshold and plot the queue occupancy over time for each
  . Clearly, the queue starts to become empty for significant time periods when is much lower than the prescribed threshold of , corresponding to
  .
.
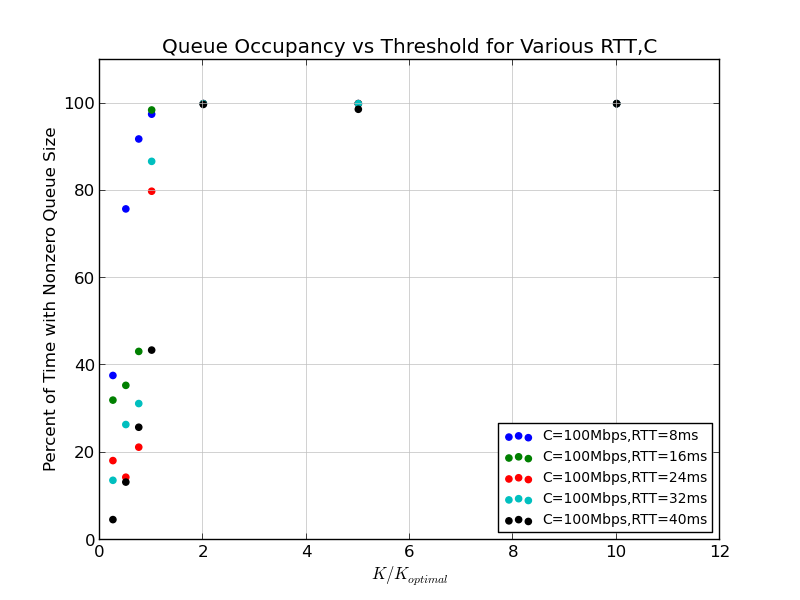
The second series of plots (Figure 2) show the robustness of the threshold sizing result for various values of and . For each , combination, denoted by a distinct color, we sweep over a range such that ranges between ¼ and 10. We then plot the the percentage of the total experiment duration that the buffer was empty versus the marking fraction for various , combinations.

Figure 2: Robustness of Threshold Sizing Result to Various and .
As in Figure 1, the threshold is changed relative to the prescribed result and we clearly see the occupancy tends to zero for increasing durations as becomes too small compared to . However, for small thresholds compared to the prescribed result, higher RTTs tend to keep the buffer empty for a longer duration. Though the DCTCP authors do not show this phenomenon, it can be explained by the fact that higher RTTs lead to more latency in the DCTCP feedback mechanism. One should note that the authors do make it very clear that their results hold strictly for the data-center environment (high capacity, low RTT), higher RTTs begin to violate this assumption.
As expected, we clearly see the general trend that the buffer becomes increasingly un-occupied for longer durations as approaches zero. We quantify the percentage of the total experiment duration that the buffer was not empty on the y axis, calculated as  .The previous results indicate that there exists a transition value for above which the queue will never under-run and below which the queue will indeed under-run. Rather than sweep over a predefined range, we implement a fine search over thresholds to determine the minimum value of such that the queue never under-runs.
Also note in the above plot that we observe constant queue occupancy for a scaling factor >= 2. To further strengthen this result we implement a procedure with strong analogies to a binary search for buffer sizing in [2]. Starting from an initial value of , we measure the percentage of time the queue was nonzero and binary search from there onwards. Rather than enforce a strict criterion that the queue ‘never under-runs’, we implement a soft constraint that ‘the queue never falls to zero more than 5% of the time’ in order to tolerate measurement noise. We find the buffer never under-runs at around  . Our results are representative since we used a variety of , combinations and swept through several values of per link setting. We have omitted this procedure from the code on the image as it took hours to run. The above figure should be sufficient in reinforcing this result.
Challenges:
Conceptual challenges were minimal in this project as the authors were extremely clear about the assumptions for deriving threshold . Further, the authors are clear that they assumed that flows were synchronized in the analysis. Since we clearly saw unsynchronized flows, we were able to see less variation in the buffer size and thus tolerate lower values of .
Technical challenges were minimal since the installation of the DCTCP patch on Mininet has been tested before and is well-documented. The most significant technical problem was Mininet can not emulate high-bandwidth links such as 1GBps with high-fidelity, so we cannot validate representative speeds used in the paper and actual data-centers. Additional technical challenges surprisingly mainly came from plotting in python which was something we had not done before.
Critique:
Overall, our experimental validation in Mininet seems to confirm the paper’s threshold sizing result. As the threshold was brought below the optimal value predicted by the paper, the queue did under-run, resulting in losses of throughput as expected. Further, we needed a safety margin where had to be at least about 5 times the predicted threshold in order for the buffer occupancy to be stable with minimal fluctuations. This matches the claim made in the paper that should be larger than in practice. Overall, the results show the robustness of the threshold sizing result across a variety of , scenarios for a representative topology.
Simulation Platform:
The Mininet network emulator was a natural choice as it allows easy configuring of RED parameters in Linux and can emulate ECN-enabled switches, both of which are integral components to DCTCP. Further, there are a suite of useful utilities for monitoring throughput and queue size which allowed us to focus on the details of validating the robustness of the threshold sizing result.
Our Mininet setup is extremely reproducible as detailed in the README. The parameters that affect reproducibility the most are the choice of and , since these directly affect the predicted value of . Since Mininet cannot emulate high-bandwidth links with great fidelity, we were careful in setting to a maximum of 100 Mbps.
Instructions to Reproduce:
Loading our custom image with the DCTCP patch:
1. Visit https://console.aws.amazon.com/ec2/home?region=us-west-2 to create an image in the us-west-2 region. Click Launch an Instance.
2. Select Launch Instance.
3. Select Instances -> Instances in the left pane.
4. In the Create a New Instance box, use the Quick Launch Wizard. Name the instance and select a key pair.
5. In Choose a Launch Configuration, select More Amazon Machine Images.
6. Search for our custom Amazon Machine Image (AMI): CS244-Win13-DCTCP_Threshold
7. Continue and use a c1.medium or c1.large instance.
Running the experiments:
1. Run the experiment.sh script (./experiment.sh) within the pa3/ directory. This script runs the experiments and plots all figures to the plots/ directory. An explanation of all code is in the README.
References:
[1] Alizadeh, Mohammad, et al. “Data center tcp (dctcp).” ACM SIGCOMM Computer Communication Review 40.4 (2010): 63-74.
[2] Appenzeller, Guido, Isaac Keslassy, and Nick McKeown. Sizing router buffers. Vol. 34. No. 4. ACM, 2004.

5/5: We were able to recreate the results. However making the image load on to EC2 took multiple trials. After loading the instructions were good to recreate the results. However looking at the plots were in
plots were in results “date time” folder which is not mentioned in the instructions.
Pingback: CS244 ‘16 DCTCP | Reproducing Network Research·