Team
Alexander Leishman (aleish at stanford), Henri Stern (sternh at stanford)
Paper
T.-Y. Huang, N. Handigol, B. Heller, N. McKeown, and R. Johari. Confused, Timid, and Unstable: Picking a Video Streaming Rate is Hard. In Proc. IMC, 2012.
Reproduction
The original code is available here. The VM to reproduce the experiment here.
Original Goals
In Confused, Timid and Unstable: Picking a Video Streaming Rate is Hard[1], the authors try to provide readers with an understanding of how bitrate selection for video streaming over HTTP works and of its shortcomings. They demonstrate a particular phenomenon that accounts for poor bitrate selection in video players faced with competing flows – the downward spiral effect. Finally, the paper puts forth solutions to mitigate this phenomenon and thereby validate its own explanation of its causes.
The bulk of the paper focuses on explaining the downward spiral effect and its causes. This problem can lead to video players’ selection of the lowest video bitrate setting, therefore degrading quality of experience for users. Video streaming accounted for about half of Internet traffic when the paper was published in 2012[2], and this trend has only accelerated with services like Netflix, Youtube and Twitch accounting for over 70% of Internet traffic in North America today[3] and projected to account for over 80% of traffic in 2020[4]. Therefore, exploring the evolution of the causes of the downward spiral effect since 2012 is a meaningful exercise since video delivery over HTTP remains a preferred means of distribution.
Motivation
The authors demonstrate that video clients’ heavy reliance on bandwidth estimation to choose their own video rate leads to this downward spiral as it comes to head with features of the TCP protocol. Specifically, all three video clients tested in the paper operate similarly: they fill their playback buffer then fall back to an ON-OFF sequence requesting 4 seconds of video every 4 seconds. However, this 4 second OFF period causes the TCP congestion window (cwnd) to time out and resets it to its initial size and slow-start. In the presence of a competing flow, this process spirals out of control as the player begins to underestimate available bandwidth and reacts by setting a lower video rate and requesting smaller segment sizes from the server, preventing the cwnd from exploiting available bandwidth and growing.
Subset Goal and Motivation
We are choosing to reproduce this paper’s look into the dynamics of client requests in relationship to its buffer state (Figures 6a and 6b). Many factors come together to create the downward spiral, but at their heart is the cwnd timeout that occurs when the client moves to the ON-OFF request sequence after its buffer is full. This run-in with the TCP protocol sparks the cwnd reduction and slow-start that lead to throughput underestimation in the presence of competing flows. We are curious to see whether 5 years on this mechanism has changed in video players as the lessons from this paper and others[5] suggesting using a mix of throughput estimates and buffer occupancy for bitrate selection have been adopted.

Subset Results
Our work in reproducing this experiment started with an analysis of Netflix’s client logs. Netflix’s video client has a number of developer tools available (using control + alt + shift + [S|D|L] on Mac) which we went through to understand how the video buffer in the client functions.


Netflix developer tools (left to right): client info panel, logs, bitrate and CDN selector
Using the available logs, we noticed that the fundamental buffer-filling behaviour of the client is the same now as it was in 2012: the client aggressively requests 4-second segments until it is full, then requests new segments every 4 seconds to refill the buffer as it drains it.
However, we did notice certain differences between our client and that shown in the paper:
- Our client’s buffer usually fills in under 25 secs (vs 185 in the paper) under good network conditions.
- During the ramp-up phase, our client’s requests for 4-second chunks are made every 0.5 secs (vs 1.5 in the paper).
- Our client’s max bitrate under good network conditions is 2370 kbps (vs 1750 in the paper).
We feel all of these differences can be explained by changes in the state of Netflix’s infrastructure and video streaming tech since 2012. In fact, it is quite surprising to see that beyond these minor changes, Netflix’s client behaviour has remained so consistent over the last 5 years.
With these insights in hand, we moved to automate our experimentation process to reproduce the results from the original paper. To do this, we built a Ruby script that automatically launches a Chrome browser, loads and logs into netflix.com, plays a video and allows it to run for 90 seconds before dynamically generating throughput and request graphs based on the parsed client logs.
Our results are as follow:


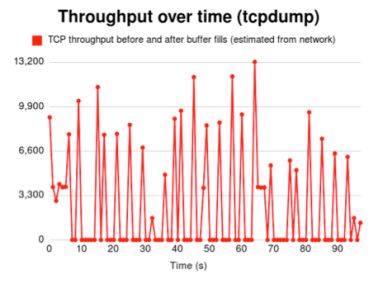
The green dashed line on the left graph indicates the moment at which the buffer is first filled entirely. Looking at the right graph, we can see that before this mark (at 18 seconds here) requests are made repeatedly every half second or so. After the buffer fills, they are then made every 4 seconds or so. Looking at the left graph, we can the connection is used consistently as the buffer fills, and only at regular 4-second intervals thereafter. The difference between our throughput graph and the paper’s comes from our sampling technique (see Challenges and Notes), but the results are consistent. We chose to abort the experiment under network conditions for which the buffer will not fill within 90 seconds.
Challenges and Notes
In this section, we’ll focus on a few of the main challenges we encountered.
Access to a testing Environment
We gained a lot by running our tests directly on the Netflix client. However, we quickly noticed it is not a testing environment as we had our own accounts throttled when we began running our tests too frequently (a half-dozen times a minute or so). This required changes to our testing environment, and had us develop offline tests run on collected data so we could be more independent from the live client itself.
Throughput Definition
A recurring issue we faced is interpreting the throughput numbers in the initial paper. The paper lists throughputs that are usually around 5kbps, which is around 0.6MB/s. We find this to be extremely slow. Netflix’s own info screen (which we take to be reliable data) lists average throughputs between 30k and 120k kbps (between 3.75MB/s and 15MB/s), which is more in line with our expectations of network performance. Calculating throughput ourselves, we ended up with varying numbers based on our approach, some closer to Netflix’s own (using their log data) and others to the paper’s (doing packet sniffing). We believe the authors of the original paper and those who built the Netflix dev tools may be calculating throughput differently, though neither explain their process. Looking at the buffer size during its ON-OFF state, we are able to tell that the 4 seconds of video represent between 700kB and 1mB of data (at 2370 kbps bitrate), or around 6,000 kb. This number does not automatically rule out either set of throughput figures.
Data Collection
While the existence and availability of Netflix’s own developer consoles really helped our work and provided a sturdy base of data to start from, it also made some parts of this experiment more challenging, specifically, capturing throughput data.
- The Netflix info screen (left picture above) directly displays throughput, which we thought would be sufficient for our purposes. However we quickly noticed that this measure of throughput (usually between 30k and 120k kbits) is only updated every second or so, which is not as granular as we need to reproduce the paper’s experiment.
- We then turned to the Netflix logs (center picture above), which record the arrival of numbered video chunks (“Received chunk”) and their consumption by the player (“Feeding media segment to decoder”) allowing us to track buffer fullness over time and request frequency. However, while they do show us data at a chunk level (an app layer notion) they do not present any data about the network state itself, and make calculating throughput complex. Specifically, we are only able to tell when full chunks arrive, but we have no data regarding TCP packets or the makeup of these chunks while they are in flight or prior to arrival.
- Our third approach was then to move below the chunk abstraction to the TCP packet layer. We tested both tcpdump and scapy and settled with using scapy. Sniffing the network for the duration of our experiment, the challenge was to isolate the Netflix video data from other data coming to our machine. In order to do this, we did an nslookup on the top 3 source IPs sending our machine data during the experiment and only kept the data coming from IPs reliably linked to netflix.com. This yielded the results shown on the right.
We can see here that the network is constantly used by the client until around second 8 (buffer fullness in this experiment), as was shown in the paper.
However, the behavior of the captured throughput during the experiment (around second 30 and 65), and the inconsistent readings we got when replicating this approach multiple times (notably in a VM, see below) pushed us to abandon this approach for now. Specifically, we believe our data may be inconsistent with the Netflix log readings because:- Netflix does data encoding and compression per scene, and based on the type of video being watched (e.g. cartoons and live-action scenes have different needs, as do dialogue and movement)[6]. This creates a potential gap between network-based throughput readings and chunk reception (all chunks are not the same size).
- We cannot be sure we isolated our video sources appropriately.
- We noticed that throughout the 90-seconds, at least 3 ports are being used on our machine to receive video content. While we weren’t able to observe them being used concurrently, we question whether the throughput readings should be based on a single TCP flow, a multiplexed flow, or multiple flows.
Given that the original paper gives no indications as to how they performed these readings on the original clients (not their custom one), we decided to rely on the Netflix log data, given the assurances we have about data quality there.
To estimate throughput backwards from chunk reception, we needed two elements: chunk size, and time it took to download (we don’t know when the client makes requests, only when it receives chunks). For chunk size, we take the average bitrate over the duration of our experiment (it is constant under good network conditions) and multiply it by 4 (the chunks are 4 seconds long). The trickier part is estimating the time it takes to download a chunk. Here, we choose to look at the average time between chunk receptions during the initial buffer-filling phase, and treat that as the time between chunk request and reception: the time to download a chunk. Our rationale is that in this initial build up, the client is making requests as often as it can, serially, and thus fully utilizing the network. We are fully dependent on the assumption that requests are made serially. On average, the time between chunks received in the build up phase is usually around 300ms, vs 1.3s on average over the duration of our experiment.
VM Connectivity
In order to make our own work reproducible, we migrated it into an Ubuntu Disk image to be run within a virtual machine. However, we quickly noticed that network conditions in a Virtual Machine are far worse than those on our host machines (a 100 MB/s download speed on Stanford campus became 20 MB/s in the VM, with high variability). By switching the VM’s networking mode from NAT to host-only networking, we were able to palliate some of the difference and regain some regularity in our experimental behavior. Our network sniffing nonetheless became rather erratic in the VM, which contributed to our stripping it from our experiments.
Critique and Extensions
In spite of the lack of direction the authors gave in estimating network throughput, their main point behind the client behavior as it fills the buffer and once the buffer is filled still holds today. In fact, it’s quite astonishing how little has changed and how much the aggressive build-up then ON-OFF pattern remains the MO of the Netflix client. If Netflix has sought to defend against the downward spiral, it is not by shortening the time between requests during the ON-OFF state (and subsequent TCP cwnd size reduction that ensues).
We moved a bit beyond the original paper’s own exploration of this buffering behavior (to be fair, it was only a small part of their paper vs the entirety of ours) in looking at it under various network conditions. We were forced to do so in switching to the VM, but also experimented with our own connection emulator to observe how the client behaves as it is forced to drain the buffer under poor network conditions and move back to ramp-up when the conditions improve.
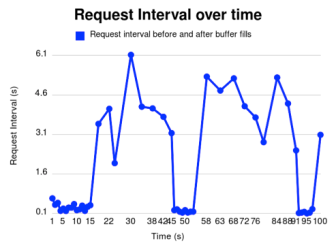
Here you see request intervals as Network conditions worsen and the buffer is drained at seconds 42 and 86.
Platform Choice
We chose to use a transferable disk image rather than on Google Cloud as our experiment is based around Netflix’s live client. While there are ways to automate the experiment headlessly, it was far more simple to provide an environment where a browser could be launched and acted upon, hence the VM. While this has a negative impact on network performance, as stated, we believe it nonetheless makes the experiment easily reproducible, and far more interesting to run than through a headless web client running on a cloud machine, for instance.
The downside of this is that under bad network conditions (e.g. 5MB/s), the client buffer will not fill within the experiment lifespan (90s) and thus not yield the wanted result. We chose to abort the experiment when the buffer is not filled.
README: Reproduction
To reproduce the experiment follow the following steps:
- Download and install VirtualBox (you should already have it if you have taken CS 244)
- Get our disk image here, and double click it to import it into VirtualBox
- Log in to Ubuntu
- Username: cs244
- Password: cs244
- If you are running this experiment after June 15th, 2017, we will have disabled the credentials in the VM. Replace them with your own (see below).
- Double click the “live experiment” icon on the desktop, and watch it run for 90 seconds before seeing the charts appear
It should be noted that we also included an “offline experiment” script that performs the same analysis on logs we captured under pristine network conditions (outside of the VM). These results are closer to the paper’s own results than some of what can be obtained under spotty conditions when running the live experiment in the VM. All data captured is available in the data subdirectory of the experiment code.
Troubleshooting steps – if the live experiment does not run
- Internet connection – Check that you can connect to the internet on the VM, if you cannot, your Virtual Box configurations may be wrong. Make sure you have two adapters enabled for the image (NAT and host-only, and both have “Cable Connected enabled”).

- Netflix credentials – We will take down the used Netflix credentials after June 15th, 2017 (as stated above); and the account may be throttled before then.
Thus, to replace the credentials, open ~/Desktop/netflix_and_chill/run_live.sh with your favorite editor to read and replace them with your own as needed.
[1]http://yuba.stanford.edu/~huangty/imc012-huang.pdf
[2]https://www.cisco.com/c/en/us/solutions/collateral/service-provider/visual-networking-index-vni/vni-hyperconnectivity-wp.html
[3]https://www.sandvine.com/resources/global-internet-phenomena/2016/north-america-and-latin-america.html
[4]https://www.cisco.com/c/en/us/solutions/collateral/service-provider/visual-networking-index-vni/vni-hyperconnectivity-wp.html
[5]https://web.stanford.edu/class/cs244/papers/videostreaming-sigcomm2015.pdf
[6] https://medium.com/netflix-techblog/per-title-encode-optimization-7e99442b62a2

Reproducibility score: 5/5
The instructions were very clear and the results are easy to reproduce due to well-setup VM that is provided. Unfortunately, we were not able to get fast enough connection through to the virtual machine to successfully run the live experiment, but the offline experiment ran perfectly, and the results matched identically to the results in the blog post. Running the experiment takes no longer than 5 minutes from booting the VM to displaying the plots.
For reference, here are the plots we reproduced:
fig1: https://drive.google.com/open?id=0BwuLLdq7RbLQY0xjOWVhQ1BGX1k
fig2: https://drive.google.com/open?id=0BwuLLdq7RbLQNzBETmpzaWxRTmc