Authors: Rebecca Wang (rwang7), Hope Casey-Allen (hcaseyal)
Motivation and Goals:
Denial of Service attacks can prevent or degrade the service of users by consuming resources in networks, server clusters, or end hosts. Many different varieties of DoS attacks exist, such as TCP SYN attacks or DNS flood attacks, but one commonality is that these attacks generally require high-rate transmission of packets. This presents a statistical anomaly that allows network monitors to detect and block the attack. In “Low-Rate TCP-Targeted Denial of Service Attacks,” Kuzmanovic and Knightly present a class of low-rate, or shrew, attacks that can severely disrupt TCP flows while evading detection. Using modeling, simulations, and Internet experiments, the paper demonstrates the effectiveness of these maliciously chosen traffic patterns.
Authors’ Results and What We Reproduced:
TCP congestion control relies on the implicit assumption of end-system cooperation. The particular TCP mechanism the authors target is the Retransmission Time Out (RTO) mechanism: in times of severe congestion, flows reduce their windows to a single packet and wait for a single RTO, after which that packet is resent; further loss causes the RTO to double. With “square wave” shrew attacks that alternate between outages (bursts of packets that exceed the bottleneck link capacity) and sending no packets, the authors exploit repeated timeouts to disrupt throughput.
For a single TCP flow, the attacker can force the flow’s throughput to 0 if they send an outage timed with the flow’s RTO. Figure 4 from the paper plots the normalized throughput of the TCP flow versus the DoS interburst period (both for the analytical model provided and for the experimental results). In particular, note that the throughput reaches 0 at two points: interburst period = minRTO and interburst period = minRTO / 2.

The paper then considers multiple TCP flows: flows with homogeneous RTOs also experience most of their traffic being throttled, while attacks against TCP flows with heterogeneous RTOs are less effective. However, for our project, we choose to focus on examining the effects of a shrew attack on a single TCP flow and reproduce Figure 4. We believe that this is one of the most significant contributions of the paper because it demonstrates a huge vulnerability in TCP, while also being relatively simple to replicate.
In addition, the paper addresses the effectiveness of shrew attacks on different variants of TCP. More specifically, the paper launches shrew attacks with interburst periods of 30ms, 50ms, 70ms, and 90ms for TCP Reno, New Reno, Tahoe, and SACK, shown in Figure 12. Figure 12a shows that TCP Reno is the most fragile variant, but at higher interburst periods, the throughputs of all the variants suffer. We extend the results of the paper with modern variants of TCP.

Platform and Setup:
We chose to use Mininet to set up our network topology because of our familiarity with it from a previous project. Our setup is as follows: we have an innocent client running a long-lived iperf flow, an attacker client that sends bursts of UDP packets over a raw socket, and a server that both clients communicate with. These machines are connected through two switches s0 and s1, as shown in the topology diagram below. The bottleneck link is between s0 and s1, and has a throughput of 1.5 Mbit/s, while all other links have a throughput of 500 Mbit/s. In addition, each link has a propagation delay of 2ms, for a total round trip propagation delay of 12ms. 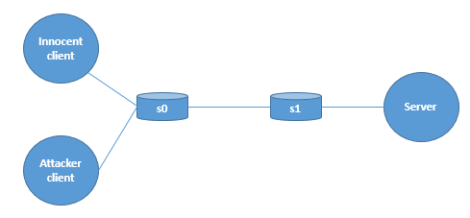
For our setup to reproduce Figure 4, the shrew attack has an burst duration of 150ms. All of these values (bottleneck link capacity, round trip propagation delay, and interburst period) are the same as those used in the paper’s experiment. In addition, we set the queue size such that the condition specified in the paper (C1 in section 3.2) holds: that burst duration is always at least as large as the RTT.
Results:
We were able to reproduce the shape of Figure 4 and get two dips at roughly the same interburst periods. We ran three iterations for each interburst period value, and provide graphs for both the average and minimum normalized throughput. However, note that the throughput never quite reaches zero.

Average normalized throughput vs. interburst period (sec)

Minimum normalized throughput vs. interburst period (sec)
Challenges:
The paper assumes that there is a minRTO of one second under TCP Reno. However, this assumption doesn’t always hold in modern Linux systems; using “ss -i” to see the minRTO of active connections, we discovered that the minRTO was actually around 200-300ms. Thus, our initial attempts at reproducing Figure 4 yielded the following graph:
Throughput (Mb/s) vs. interburst period (sec)
Note that the dip is now happening around 200-300ms instead of 1s in the original Figure 4, which is still consistent with the paper’s result considering that the minRTO is different.
We first tried to change the minRTO on a per-route basis using an “ip route change” command on the connections listed with “ip route.” The minRto we set showed up as “lock [minRto]” at the end of each entry. However, this had no effect on our experiments, and it turns out we needed to set the minRTO from within Mininet. Our solution was to use the Mininet CLI while our experiment was running to find the client IP, set the minRTO with “ip route change”, and verify that the change occurred with “ss -i” from within the mininet CLI. A challenge with this was that “ss -i” from outside the mininet CLI does not show the minRTO as configured from within Mininet, so it appeared that our configuration wasn’t working when it actually was.
The paper mainly tests the Reno variant of TCP and then later compares it to New Reno and other TCP variants. However, it appears that Reno has been replaced by New Reno in the Linux kernel [1][2], so although we specify “reno” as our congestion control algorithm, New Reno is actually being used. This could explain why we are not able to achieve exactly the paper’s results in terms of reaching zero throughput at the null points.
We had several challenges reproducing the paper’s results under TCP Reno/SACK/Tahoe (Figure 12) for a couple of reasons. First, we were not able to easily install these TCP variants. The Linux kernel supports modules for easily switching between TCP congestion control variants. The list of available modules can be viewed through “ls -la /lib/modules/$(uname -r)/kernel/net/ipv4”; by default on our system, SACK and Tahoe are not installed and “reno” is actually just New Reno. A list of what TCP variants the kernel has configured can be found through “grep TCP_CONG /boot/config-$(uname -r)”. We tried installing the modules through “modprobe -a tcp_sack”, and “modprobe -a tcp_tahoe”, but the modules were not found because they are not included in our kernel. In other words, it seems that we would have rebuild the kernel to include other modules that are not already present as options [3]. Second, considering that TCP Reno/SACK/Tahoe have largely been replaced by other TCP algorithms in modern systems, it seemed more interesting and applicable to see how well the shrew attack performs on algorithms widely used on modern systems.
Initially, we set up our topology so that the client was fetching web pages from the server and the attacker was using iperf in UDP mode to send bursts of packets. This produced highly variable results, probably due to handshake packets from the client getting dropped sometimes and not at other times. The solution to this was to run a longer-lived flow for the client.
We had minor trouble in setting up a convenient way for people to view the graphs after reproducing our experiment. We investigated a few options: 1) enabling x-forwarding and viewing the images through an image viewer like eye of gnome, 2) scp, 3) installing a GUI via VNC. X-forwarding is not enabled by default when SSH-ing into Google Cloud instances and has some complications [4], using scp to download the graphs to a local machine requires the user to first generate a new SSH key-pair [5], and VNC requires more setup [6]. Ultimately, using a python SimpleHTTPServer to serve up the graphs directory minimized the amount of work for the user to reproduce our results.
Extensions:
We investigated the shrew attack on TCP Cubic, Vegas, and Westwood. Cubic was the default linux congestion-control implementation as of 2013, so it demonstrates how well shrew performs today. Vegas, as an older algorithm, provides a foil for Cubic and shows how shrew might have performed closer to the time the paper was published. Westwood is optimized for lossy networks, so we were interested in how it would handle the shrew attack considering that shrew attacks cause a lot of loss.
Cubic, avg throughput

Cubic, min throughput

Vegas, avg throughput

Vegas, min throughput

Westwood, avg throughput

Westwood, min throughput
The shrew attack performed consistently on TCP Vegas, as seen from how the average throughput graph matches the min throughput graph. Note how a near-zero throughput is reached at both null points. Westwood was more inconsistent, as seen from how the average throughput graph is a noisier approximation of the ideal shrew attack shape and the min throughput graph achieves close to an ideal shape. Cubic, on the other hand, achieved a consistently higher throughput even at the null points; in the graphs above, Cubic stayed at or above 0.2 normalized throughput. It would seem that Cubic, the default algorithm on our system, is the most resilient to shrew attacks.
Critique:
While we were able to show that shrew attacks can severely impact throughput, we were never able to replicate zero throughput, so shrew attacks might not be as crippling today as the paper originally claims. In addition, with all the different variations of TCP available today, it seems like this this attack would have difficulty succeeding in practice. It requires knowing precise details like the minRTO, which may vary across users, and the min and max RTT. In our results, it was most effective on TCP Vegas and least effective on Cubic, the default congestion control algorithm on many Linux systems. The shrew attack may have been more effective when the paper was written, but there seem to be too many variables for it to be a worthy choice of attack vector today.
README:
Reproduce instructions
- Create a new Linux instance on Google Cloud. Follow the instructions here to create a virtual machine instance (https://cloud.google.com/compute/docs/quickstart-linux) EXCEPT replace step 4 with: “In the OS images tab, choose the Ubuntu 14.04 LTS image.” Also, make sure you select “Allow HTTP traffic” in the Firewall section.
- Follow the instructions to connect to your instance through ssh (click on the SSH button). The terminal window pop-up may be blocked, so make sure you enable pop-ups from Google Cloud.
- sudo apt-get update
- sudo apt-get install -y git
- git clone https://github.com/hcaseyal/cs244-PA3.git
- cd cs244-PA3
- chmod 755 installDependencies.sh
- sudo ./installDependencies.sh (may take several minutes)
- sudo ./run.sh (takes ~2.5 hours). When the experiment is done, the last line in the terminal should read “Serving HTTP on 0.0.0.0 port 80”
- To view the graphs, first find the external IP of your Google Cloud instance on the instances page (a page refresh may be needed). See the link in step 1 if you no longer have the “instances” page open. Go to the address of your external IP in Google Chrome e.g., http://104.154.17.88/graphs/

External IP is the second to right column on the instances page
The shape of the reno graphs should be similar to figures A and B in the Results section above. There are also graphs for the extension section, named with their respective control algorithm (Cubic, Vegas, Westwood).
References:
- https://tools.ietf.org/html/rfc3782
- http://netlab.caltech.edu/projects/ns2tcplinux/ns2linux/
- https://fasterdata.es.net/host-tuning/linux/expert/
- http://atechyblog.blogspot.com/2014/12/google-cloud-compute-x11-forwarding.html
- https://cloud.google.com/compute/docs/instances/connecting-to-instance#generatesshkeypair
- https://medium.com/google-cloud/linux-gui-on-the-google-cloud-platform-800719ab27c5

5 – Code ran to completion and results matched very well with the blog post
The graphs were very close to the original, but some of our graphs had higher throughput with bursts at the minRTO, probably just due to Google cloud scheduling variability. Our graphs also never reached 0 throughput, which was good analysis on the part of the authors. The graphs were also kind of hard to read due to the marker color and type. The overall analysis was good, but could have stated more implications of their results.