Project Name: Jellyfish vs. Fat Tree Bandwidth
Team Members: Elliot Conte – eaconte@stanford.edu / Diego Franco – diego2@stanford.edu
Key Result(s): Jellyfish, a randomly constructed network topology can achieve similar and often superior average throughput to a Fat Tree. These results were confirmed by our use of Mininet, Openflow and our own implementation of the Jellyfish topology and k-paths routing.
Source(s):
Jellyfish: Networking Data Centers Randomly : http://www.cs.illinois.edu/~pbg/papers/jellyfish-nsdi12.pdf
Ankit Singla, Chi-Yao Hong, Lucian Popa, and P. Brighten Godfrey. 9th USENIX Symposium on Networked Systems Design and Implementation (NSDI), April 2012.
Blog post with very good visualizations:
http://youinfinitesnake.blogspot.com/2012/04/jellyfish-networking-data-centers.html
Introduction:


. Fat Tree Jellyfish
The creators of the Jellyfish topology present a remarkable and surprising result in their research, that a randomly constructed Data Center topology “supports more servers at full bisection bandwidth than an equal-cost fat-tree and with lower mean path length” and “also provides high connectivity and path diversity”. This may seem hard to believe at first, but the intuition does make sense.
A Jellyfish topology is constructed by taking a number of switches and then randomly joining them. Basically, take a random pair of switches with free ports and join them if they are not already connected. Repeat this process until no free ports remain. Hosts are then uniformly distributed among the switches. It is not immediately clear why this should result in any particularly desirable properties when compared against the carefully architected fat tree topology, however, with a bit of explanation, the intuition is there.
Flows on a fat tree topology have quite a long path length, traveling from edge switches, up the network to the core and back down again when fully crossing the tree. However, in Jellyfish, as hosts are evenly distributed among switches, you do not have cases of core or aggregation switches with no hosts connected to them as in a fat tree. As a result, in a Jellyfish topology, flows tend to have lower path length and therefore consume less network resources, leading to a capability to support more hosts with the same number of switches as a fat tree. This key result is the goal of our project to reproduce.
Using MPTCP and k-shortest path routing (with k=8, the number of MPTCP subflows), the creators of Jellyfish were able to produce results showing equal throughput percentage between Jellyfish and Fat Tree with the same number of switches, but with Jellyfish supporting more servers/hosts. However, some elements of their experiments were unclear, for example, what was the traffic matrix used to produce these results? How many hosts were connected to each switch in the Jellyfish and was the distribution uniform?
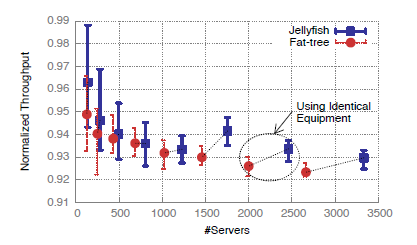
Here are the results of the Jellyfish paper comparing the average throughput of hosts in a Jellyfish to those in a Fat Tree:
As you can see in the graph above, the results of both topologies were quite similar, and hosts in both topologies experienced throughput similarly around 91 – 95% of maximum possible. It was unclear also what the authors were normalizing the throughput to in their graph, were they normalizing it to the maximum link capacity or to the maximum throughput for a single TCP flow?
Methods:
It is our goal to use multiple (4 because a fat tree with degree four has four core switches) TCP flows with parallel iperf tests, our own implementation of K-Shortest path routing using Openflow, and Mininet to reproduce these results for a random permutation traffic matrix. Our implementation of K-Shortest paths routing was our own, built from a modified breadth-first search algorithm.
Our use of Openflow is built on controller code written by Brandon Heller. The implementation of the Fat Tree and random routing for the Fat Tree topology were also written by Brandon Heller.
There were several points during our implementation where it was unclear exactly how the Jellyfish authors set up their experiment. For example, their paper is unclear, what kind of routing is used for the Fat Tree throughput results? Does the Fat Tree also use MPTCP? Their paper implies that MPTCP is used specifically for the Jellyfish so it is unclear what exactly was used for the Fat Tree test results (although it is implied that ECMP is used for the Fat Tree that isn’t certain).
Additionally, it is unclear what kind of traffic matrix was used for the throughput results. In our implementation we did a random permutation, selecting half the hosts to be senders and the other half to be receivers, we then randomly paired senders and receivers for the duration of the experiment.
We also constructed both topologies with identical hardware in Mininet.
Our experiment then worked as follows:
1. Construct the topology
2. Start the pox controller.
3. Choose a random permutation traffic matrix of senders and receivers and start the senders’ and receivers’ iperf.
4. Run this experiment three times for each topology.
5. Read the iperf output files and calculate an average throughput percentage of the maximum for each run of the experiment for each topology and graph the results.
Results:

Here we show the average throughput (as a percentage of maximum possible) for hosts in both the Fat Tree and the Jellyfish topologies over 3 runs of our experiment for k-shortest paths = 4. As shown in the graph, both the Fat Tree and the Jellyfish topology experienced extremely close average throughput for iperf tests.
Both topologies were constructed with 16 hosts and 20 switches of degree 4.
We would consider this a confirmation of the paper’s results. Although Jellyfish did not experience perfectly consistently better throughput than the Fat Tree in every experiment run, the results were extremely comparable. Typically in some tests Jellyfish would perform better (as in the runs above) and in some tests the Fat Tree would edge out, but the results were always extremely close.
The variation from one experiment to another was greater than we would have liked, as you can see in the graph above, in the third experiment both topologies experienced under 80% throughput, while in the the second test Jellyfish experienced nearly 90% of throughput capacity.
We believe that the source of the greater variation in our results was caused by the small sample size combined with the many random factors affecting performance. Since traffic matrices and paths were chosen randomly for both topologies, it is probable that the small variations of throughput from run to run were actually more a result of those random factors than fundamental properties of either topology. Additionally, when time permits only 3 (or ideally fewer) runs of the experiment with only 16 hosts, these random factors can have a significant effect on the end results.
In conclusion, it seems that the creators of the Jellyfish topology were correct, that a randomly constructed topology can have very comparable and even occasionally superior throughput to a carefully constructed datacenter topology like a Fat Tree.
In addition, we produced several other graphs for different values of k for the shortest paths routing algorithm. K controls the number of shortest paths that flows are spread over (randomly) when routing with Openflow. For example with k=1, a flow would only ever be routed over the single shortest path between source and destination. For k=2 a flow would randomly be routed over either the shortest or the second-shortest path between source and destination. The Jellyfish paper recommended using this routing algorithm (rather than normal shortest path or ECMP) because of Jellyfish’s random construction. As a result there will be a great heterogeneity in path length, unlike in Fat Tree where each pair of endpoints has multiple equal cost paths. Therefore by routing over the k shortest paths, flows are more evenly spread and this helps to reduce the chance of flow collisions creating a bottleneck link limiting throughput.
We tested smaller values of k (less flow spreading) to see the effects on throughput.

For k=3

For k=2.
As you can see in the graphs, our findings agree with those in the paper. When using less flow spreading (smaller values of k in the shortest paths algorithm), Jellyfish performs much poorer.
Validations:
Before each run of the experiment, a pingall is run for each topology, which serves to not only verify that the Jellyfish (and Fat Tree) are properly and fully connected, but also to demonstrate that our custom implementation of k-shortest paths routing is also functioning. It can be seen that the k-paths routing algorithm is functioning with good performance if the pingall progresses at the same rate for the Jellyfish as for the Fat Tree (which is using Brandon’s structured random routing code).
Additionally, the network connections are dumped and the chosen sender / receiver pairs are printed before the experiment begins so we could manually go back and read through these to make sure they are sane (each host only appears once in the list of chosen pairs for example).
Lessons Learned:
The limitations of Mininet simulation prevented us from simulating the thousands of switches and hosts used in the paper’s simulations.When using Mininet, anything above 20 switches and link speeds over 10Mbps became problematic. For our final results we kept the numbers modest, using only 5Mbps links which were much more easily saturated than the 100Mbps link speeds we started our implementation with (which never typically achieved more than 60% utilization).
Running our code with a modified riplpox controller (as written by Brandon) on top of pox code led to frequent and very unclear errors (the source of many posts on Piazza). As a result, we tried to keep the number of runs of our experiment down, so the duration was shorter. At 3 runs for each topology we found our total running time was about 10 minutes. Any more runs of the experiment and as the running time increased, so would the chance for an error that would kill the whole thing, requiring a restart of the lengthy process. So, not only because of the limitations of Mininet, but because of the instability of the code we were using, we were constrained to keep the running time of the experiment down to a small number of runs.
Additionally, as alluded to earlier in our other sections, when we actually got into trying to implement the construction of a Jellyfish topology and the duplication of results, we found that many important details were omitted from explanations in the paper which left it up to us to guess (for example what kind of routing did the Fat Tree use? ECMP is implied but it is unclear).
In summary, it was an extremely challenging process throughout. From the beginning it took some puzzling to suss out the exact methods from unclear and brief descriptions in the research paper.
We were very concerned that some of the modifications we would have to make such as not using MPTCP and using our own crude implementation of k-shortest paths routing would destroy the fidelity of our results. But while we had to make many assumptions and guesses, in the end our results produced extremely similar to those found in the paper.
Instructions to Replicate This Experiment:
Instructions to run:
1. Login to http://aws.amazon.com/console/
2. Click in “EC2 Virutal Servers in the Cloud” link
3. Select “US West(Oregon)” region
4. Launch the “CS244-JellyFish-Topology” public instance.
5. ssh to instance and type:
cd ~/project
6. Optional: open README for more information
7. type (in the ~/project folder)
sudo ./fattree-jellyfish.sh
Result will be in ~/project as rate.png. This will be for k=4 as explained above.
Notes:
EDIT: After making some changes, we haven’t been experiencing this error lately, but just in case:
Sometimes switch or host creation will just hang and will get an error with: “Write Failed: Connection Reset by Peer”. We unfortunately cannot figure out what is causing this, our crude solution is to just ssh back to the instance, run “sudo mn -c” to clean up from the previous run and try again. If this is a problem, the best way to avoid it is to simply run fewer experiments, in fattree-jellyfish.sh that can be modified in the following way:
-In the line which says “for n in 1 2 3; do” You could change this to “for n in 1 2; do”
-If you change the number of experiments in this way, make sure to change “-n 3” to “-n 2” in the arguments of python util/plot_bwd.py
Code:

Our team (Kun Yi, Tom McLaughlin) has replicated the Figure for K = 4 on an EC2 c1.xlarge instance. The instruction is very easy to follow, and we obtained results similar to what presented in the blog post. Because a random topology is used, the throughput values do not match exactly. However, results of all of 3 independent runs clearly demonstrate the main conclusion: “both the Fat Tree and the Jellyfish topology experienced extremely close average throughput for iperf tests”.
Could you make this code available again? The repository https://bitbucket.org/diegofranco82 is not working. Thanks you.